UmlDebugger FAQs
UmlDebugger can't find the source code?
The UML Debugger reads the GenSrcDir Tagged Value, and tries to read the source code from the location specified.
If the UML Debugger can't find the source code, it will notify you of that in the status bar.
Common reasons for that include
- The source code has been moved to another location after generating.
- The GenSrcDir tagged value uses a path variables (%PATH_ID%) - This currently can't be read by the UML Debugger. Try to use an absolute filename without variables.
- The GenSrcDir tagged value is overloaded.
This needs a bit of clarification. Enterprise Architect allows multiple Tagged Values on an element to have the exact same name. However, by default it will only show one of these tagged values. To find out if such a duplicate tagged value exists, enable the option Show Duplicate Tagged Values as described here: Sparx Systems - Tagged Values
We advise to delete all but one of these tagged values.
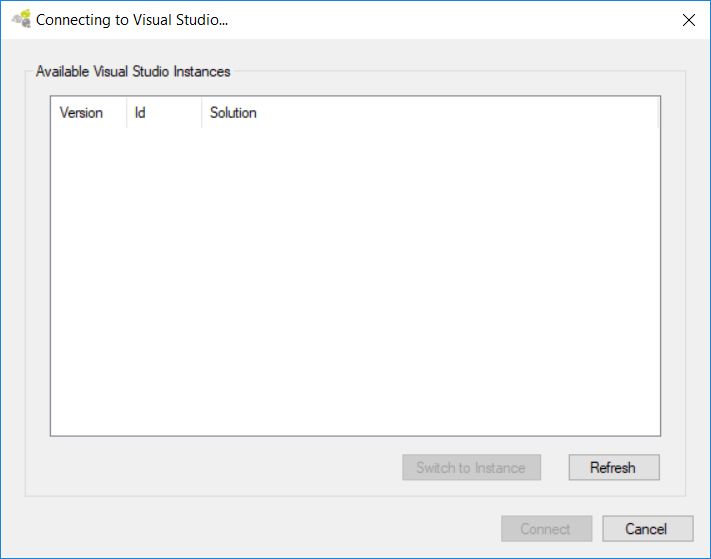
UmlDebugger can't connect to/find Visual Studio instance.
If the "Connecting to Visual Studio" dialog does not show your currently running Visual Studio instance might have the following reasons:
- The Visual Studio Extension is not installed.
- Visual Studio is running in another user context (especially as administrator).
See also
Visual Studio Extension
The Visual Studio extension supports the following Visual Studio versions/editions:
| Name | Version | Edition |
|---|---|---|
| Visual Studio 2010 | 10 | Pro |
| Visual Studio 2012 | 11 | Pro |
| Visual Studio 2013 | 12 | Pro, Community |
| Visual Studio 2015 | 14 | Pro, Community |
| Visual Studio 2017 | 15 | Enterprise, Pro, Community |
Visual Studio 2017
During installation of the Visual Studio extension in Visual Studio 2017 you might get an error:
The following extensions are not compatible with Visual Studio 2017. Installation may cause Visual Studio to be unstable.
The extension was tested with Visual Studio 2017 and no problems were found.